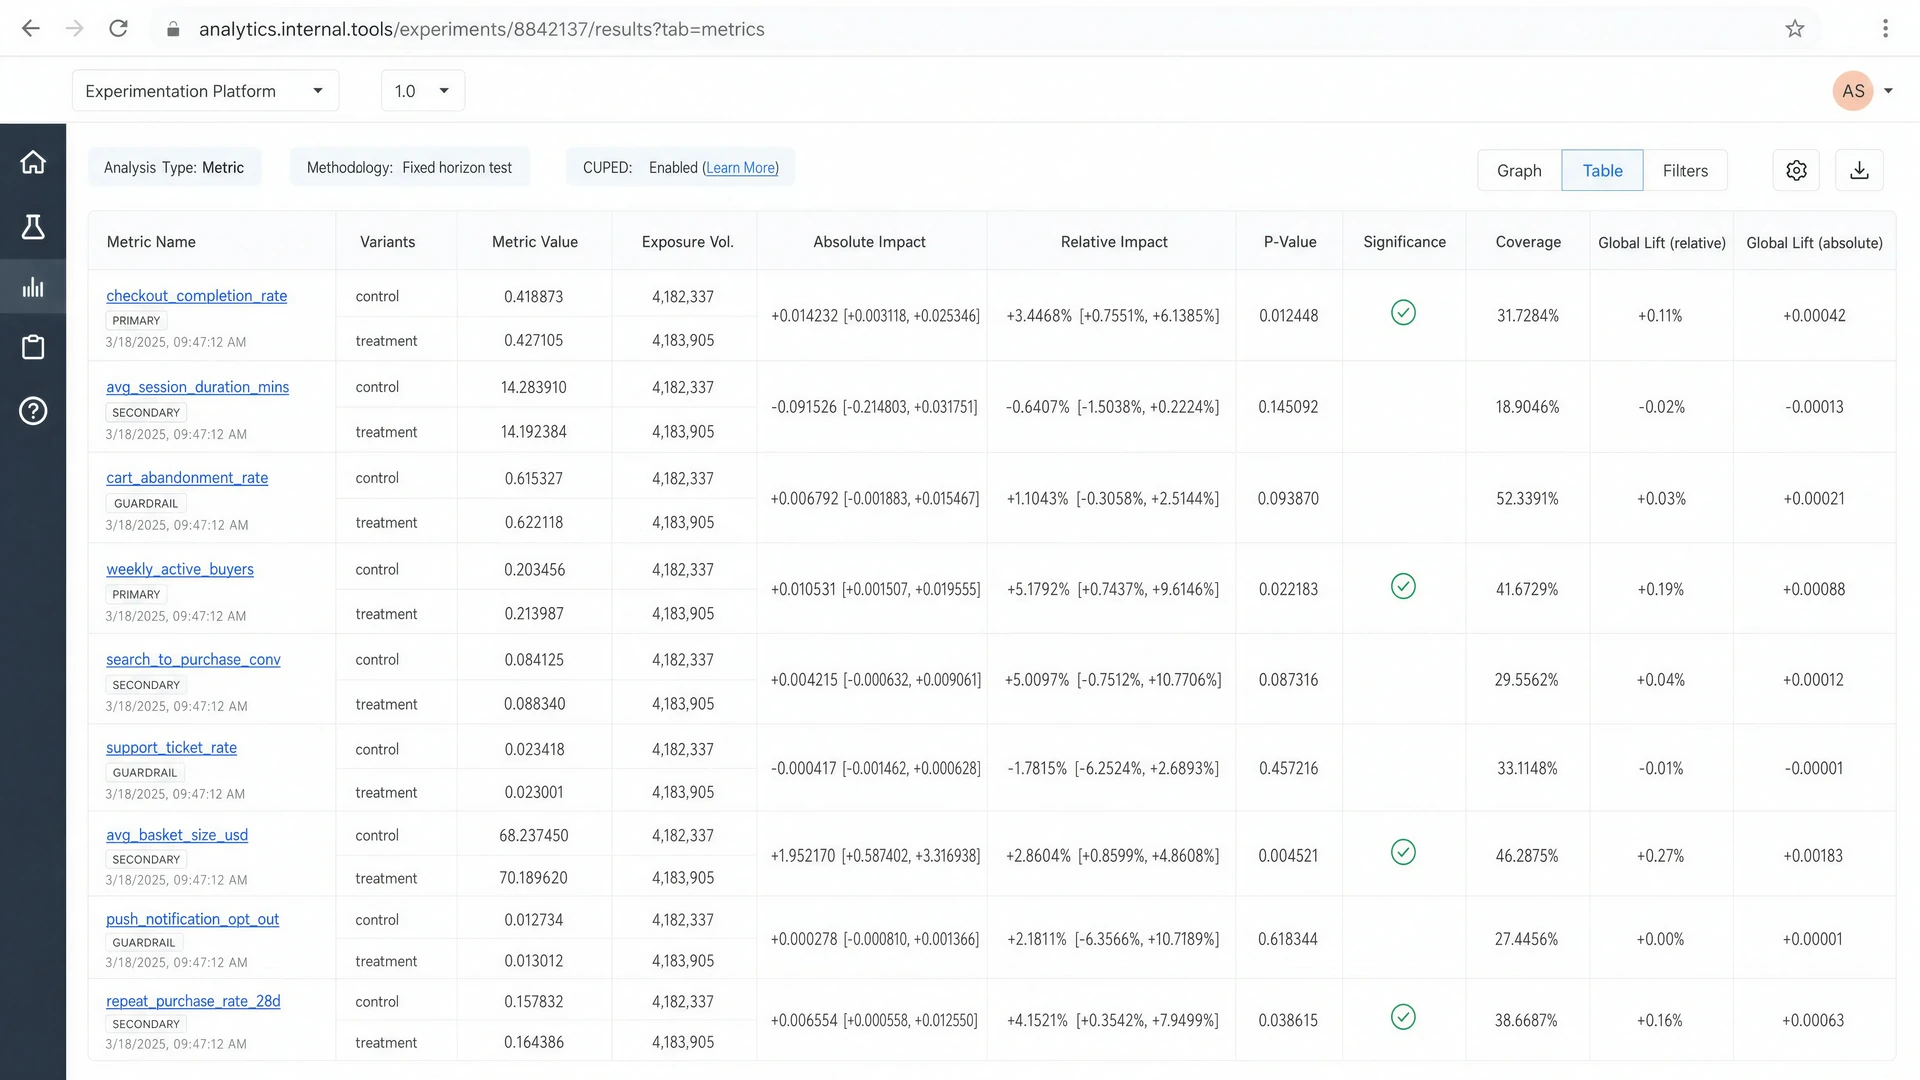
Eleven+ columns, no recommendation.
what the table couldn't say
-
01
a wall of numbers
Readers face eleven+ columns of statistics and still have to make the ship call themselves.
-
02
one view, four audiences
The detail suits data analysts. Engineers, product managers, and S&O kept asking where their experiment stood.
-
03
health checks need context
The platform flags exposure and imbalance issues. Non-analysts struggled to judge which ones could change the decision.
The Solution
I proposed two projects.
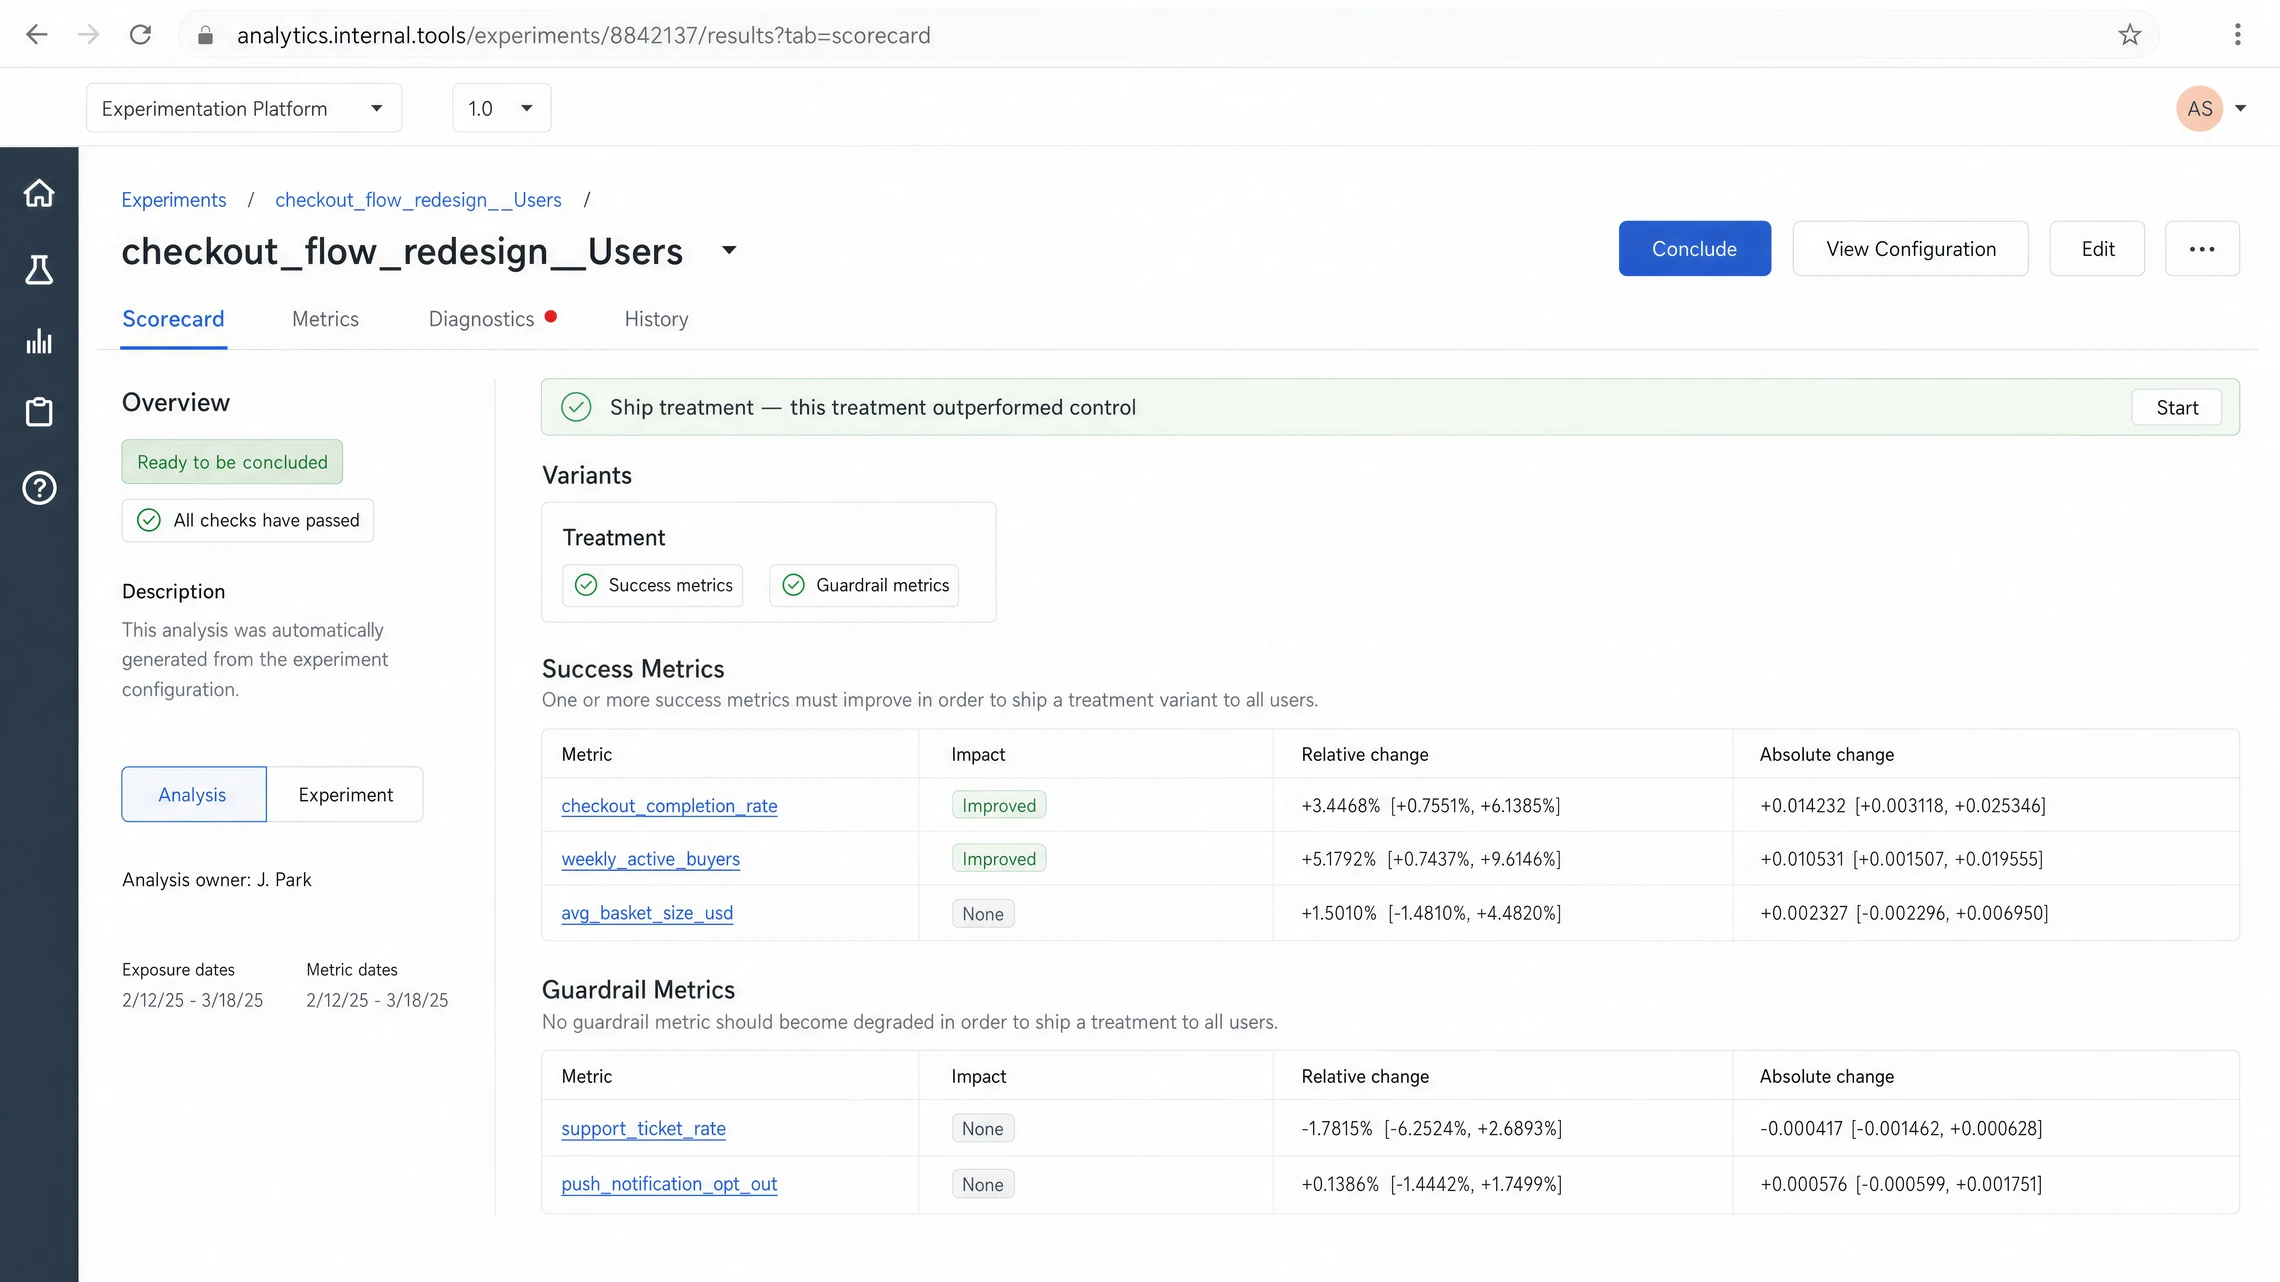
Scorecard gives teams an answer. Conclude guides the next steps.
Scorecard
One consolidated results view that recommends an action.
- Overview, variants, and success + guardrail metrics in one place
- A recommendation up front: wait, ship, revert, review, or diagnose
- Health checks explained in plain language
Conclude
A guided workflow to conclude an experiment.
- Six steps: variants, checks, guardrails, metrics, learnings, ship
- Every field pre-fills from the analysis, so nothing is re-typed
- The platform saves the final results and ships the winning variant
Two goals, a team of four.
fewer status asks
Cut #ask-experimentation status asks by about a quarter.
conclude in minutes
Bring concluding an experiment from four hours down to minutes.
Me
led the projects · front end · leadership syncs
Back-end engineer
conclude apis · data model
Data scientist · Product manager
decision rules · requirements
Stakeholders
analytics leadership · engineers & pms across orgs
The same metrics, one recommendation.

The full analysis, one recommendation.
How it went.
fewer status asks
~40% fewer
The goal was 25%. Teams found the experiment status in Scorecard before opening a thread.
conclude in minutes
10 minutes
Owners used six guided steps instead of a doc, form, and spreadsheet.
Demoed at the analytics offsite
cited in the platform's h1 accomplishments
Base of the leadership dashboard
v2 is driving broader adoption
Business-impact math
exploring one shared formula next